HOUSTON -- (Dec. 11, 2014) -- In a triumph for cell biology, researchers have assembled the first high-resolution, 3-D maps of entire folded genomes and found a structural basis for gene regulation -- a kind of "genomic origami" that allows the same genome to produce different types of cells. The research appears online today in Cell.
A central goal of the five-year project, which was carried out at Baylor College of Medicine, Rice University, the Broad Institute and Harvard University, was to identify the loops in the human genome. Loops form when two bits of DNA that are far apart in the genome sequence end up in close contact in the folded version of the genome in a cell's nucleus.
Researchers used a technology called "in situ Hi-C" to collect billions of snippets of DNA that were later analyzed for signs of loops. The team found that loops and other genome folding patterns are an essential part of genetic regulation.
"More and more, we're realizing that folding is regulation," said study co-first author Suhas Rao, a researcher at Baylor's Center for Genome Architecture. "When you see genes turn on or off, what lies behind that is a change in folding. It's a different way of thinking about how cells work."
Co-first author Miriam Huntley, a doctoral student at Harvard's School of Engineering and Applied Sciences, said, "Our maps of looping have revealed thousands of hidden switches that scientists didn't know about before. In the case of genes that can cause cancer or other diseases, knowing where these switches are is vital."
Senior author Erez Lieberman Aiden, assistant professor of genetics at Baylor and of computer science and computational and applied mathematics at Rice, said the work began five years ago, shortly after he and his colleagues at the Broad Institute published a groundbreaking study introducing the Hi-C methodology for sequencing genomes in 3-D.
"The 2009 study was a great proof of principle, but when we looked at the actual maps, we couldn't see fine details," Aiden said. "It took us a few years to get the resolution to a biologically usable level. The new maps allow us to really see, for the first time, what folding looks like at the level of individual genes."
The work to refine Hi-C and produce full-genome maps with gene-level resolution continued when Aiden moved to Houston in 2013, established the Center for Genome Architecture at Baylor and joined the Center for Theoretical Biological Physics at Rice. Aiden credited Rao and Huntley with leading the effort, which involved a team of 11 researchers at Rice, Baylor, Broad and Harvard.
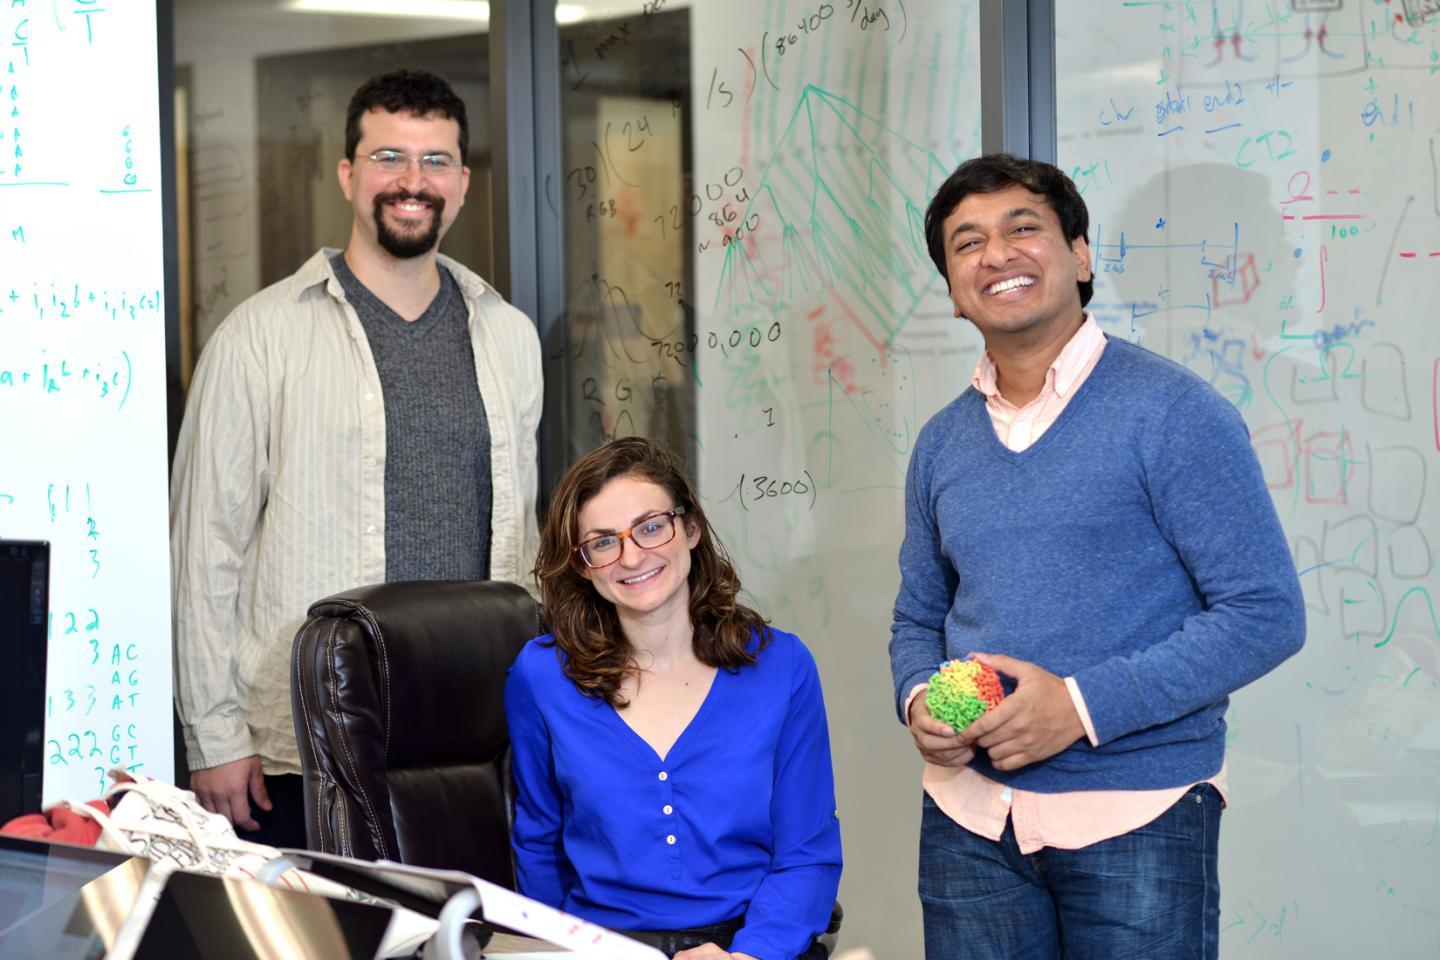
From left are, Erez Lieberman Aiden, Harvard graduate student Miriam Huntley and Suhas Rao of Baylor College of Medicine's Center for Genome Architecture.
(Photo Credit: A. Sanchez/Baylor College of Medicine)
In addition to the challenge of overhauling the Hi-C experimental design, the team faced significant computational hurdles.
"In 2009, we were dividing the genome into 1-million-base blocks, and here we are dividing it into 1,000-base blocks," said Huntley, who is a student of Aiden's. "Since any block can collide with any other block, we end up with a problem that is a millionfold more complicated. The overall database is simply vast."
Identifying the loops themselves was yet another challenge.
"Ordinary computer CPUs (central processing units) are not well-adapted for the task of loop detection," Rao said. "To find the loops, we had to use GPUs, processors that are typically used for producing computer graphics."
Fortunately, the group benefited from resources provided by NVIDIA, which named Aiden's lab a GPU Research Center in 2013 and provided essential hardware for the project.
Huntley said new methods were also developed to speed the data processing and reduce experimental "noise," irregular fluctuations that tend to obscure weak signals in the data.
"We faced a real challenge because we were asking, 'How do each of the millions of pieces of DNA in the database interact with each of the other millions of pieces?'" Huntley said. "Most of the tools that we used for this paper we had to create from scratch because the scale at which these experiments are performed is so unusual."
The big-data tools created for the study included parallelized pipelines for high-performance computer clusters, dynamic programming algorithms and custom data structures.
Rao said the group also relied heavily on data-visualization tools created by co-authors Neva Durand and James Robinson.
"When studying big data, there can be a tendency to try to solve problems by relying purely on statistical analyses to see what comes out, but our group has a different mentality," Rao said. "Even though there was so much data, we still wanted to be able to look at it, visualize it and make sense of it. I would say that almost every phenomenon we observed was first seen with the naked eye."
Source: Rice University