"This study demonstrates the power of space-based, laser altimetry for understanding Earth processes," said Tom Wagner, cryosphere program scientist at NASA Headquarters in Washington." Coupled with NASA's portfolio of other ice sheet research using data from our GRACE mission, satellite radars and aircraft, we get a comprehensive view of ice sheet change that improves estimates of sea level rise."
Previous studies used satellite radar data to measure the evolution of ice shelves and glaciers, but laser measurements are more precise in detecting changes in ice shelf thickness through time. This is especially true in coastal areas. Steeper slopes at the grounding line, where floating ice shelves connect with the landmass, cause problems for lower-resolution radar altimeters.
ICESat was the first satellite specifically designed to use laser altimetry to study the Earth's polar regions. It operated from 2003 to 2009. Its successor, ICESat-2, is scheduled for launch in 2016.
"This study demonstrates the urgent need for ICESat-2 to get into space," said Jay Zwally, ICESat project scientist at NASA's Goddard Space Flight Center in Greenbelt, Md. "We have limited information on the changes in polar regions caused by climate change. Nothing can look at these changes like satellite measurements do."
The new research also links the observed increase in melting that occurs on the underside of a glacier or ice shelf, called basal melt, and glacier acceleration with changes in wind patterns.
"Studies have shown Antarctic winds have changed because of changes in climate," Pritchard said. "This has affected the strength and direction of ocean currents. As a result warm water is funnelled beneath the floating ice. These studies and our new results suggest Antarctica's glaciers are responding rapidly to a changing climate."
A different picture is seen on the Antarctic Peninsula, the long stretch of land pointing towards South America. The study found thinning of the largest ice shelf on the peninsula can be explained by warm summer winds directly melting the snow on the ice shelf surfaces. The patterns of widespread ocean-driven melting and summer melting on the Antarctic Peninsula can be attributed to changing wind patterns.

This animation shows the circulation of ocean currents around the western Antarctic ice shelves. The shelves are indicated by the rainbow color; red is thicker (greater than 550 meters), while blue is thinner (less than 200 meters).
(Photo Credit: NASA/Goddard CGI Lab)
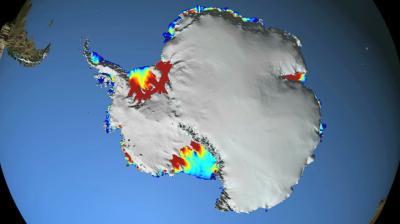
This images shows the circulation of ocean currents around the western Antarctic ice shelves. The shelves are indicated by the rainbow color; red is thicker (greater than 550 meters), while blue is thinner (less than 200 meters).
(Photo Credit: NASA/Goddard CGI Lab)
Source: NASA/Goddard Space Flight Center