The 18th century writer Adam Smith provided a workable metaphor for the way society utilizes resources. In his book "The Wealth of Nations," he argued that even as individuals strive, through personal industry, to maximize their advantage in life, they inadvertently contribute---as if under the influence of a "hidden hand"---to an aggregate disposition of wealth. Well, if Smith were a physicist and alive in the 21st century he might be tempted to compare people or nations to molecules and to replace the phrase "hidden hand" with "thermodynamic process."
EXPONENTIAL BEHAVIOR
Victor Yakovenko, a scientist at the Joint Quantum Institute (1), studies the parallels between nations and molecules. The distribution of energies among molecules in a gas and the distribution of per-capita energy consumption among nations both obey an exponential law. That is, the likelihood of having a certain energy value is proportional to e^(-E/kT), where T is the temperature and k is a proportionality factor called Boltzmann's constant.("Temperature" here is taken to be the average national per-capita energy consumption in the world.)
Studies of world energy consumption often feature plots of energy consumption or population over time. Yakovenko and his colleagues prefer to draw out the underlying exponential distribution of national energy use by plotting the fraction of world population versus per-capita consumption.
The JQI researchers draw on data from the U.S. Energy Information Administration (EIA). It covers the period from 1980 to 2010 and includes numbers from more than 200 countries; see figure 1. Their results are published in the Journal "Entropy" (2). A few years ago Yakovenko made a similar study of national per-capita income distributions (3).
Actually, the consumption data can be graphed in another way, one that illustrates the distributive nature of energy use. In a "Lorenz plot," both the vertical and horizontal axes are dimensionless. Figure 2 shows data curves for four years---1980, 1990, 2000, and 2010. The progression of curves is toward a fifth curve which stands for the idealized exponential behavior.
MAXIMUM ENTROPY
This fifth curve corresponds to a state of maximum entropy in the distribution of energy. Entropy is not merely a synonym for disorder. Rather, entropy is a measure of the number of different ways a system can exist. If, for example, $100 was to be divided among ten people, total equality would dictate that each person received $10. In Figure 2, this is represented by the solid diagonal line. Maximum inequality would be equivalent to giving all $100 to one person. This would be represented by a curve that hugged the horizontal axis and then proceeded straight up the rightmost vertical axis.
Statistically, both of these scenarios are rather unlikely since they correspond to unique situations. The bulk of possible divisions of $100 would look more like this example: person 1 gets $27, person 2 gets $15, and so forth down to person 10, who receives only $3. The black curve in Figure 2 represents this middle case, where, in the competition for scarce energy resources, neither total equality nor total inequality reigns.
Of course, the labels along the curves are a stark reminder that some nations get much more than the average and some nations much less. In Figure 2 the slope of the curve at any one point corresponds to the per-capita energy consumption. So the upper right of each curve is inhabited by the high-consuming nations: USA, Russia, France, UK. And the lower-left, lower-slope positions on the curve include Brazil and India. The movement of China upwards on the curve is the most dramatic change over the past 40 years.
INEQUALITY
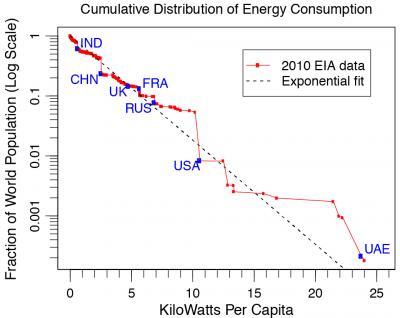
This is a plot of the fraction of world population (as displayed on a logarithmic scale) versus per-capita energy consumption expressed in kilowatts. If the data are exponential in nature, they should lie along a straight line, which they largely do. The labels show the consumption rates for several countries
(Photo Credit: Yakovenko)
The inequality between the haves and have-nots is often characterized by a factor called the Gini coefficient, or G (named for Italian sociologist Corrado Gini), defined as area between the Lorenz curve and the solid diagonal line divided by half the area beneath the diagonal line. G is then somewhere between 0 and 1, where 0 corresponds to perfect equality and 1 to perfect inequality. The curve corresponding to the maximum-entropy condition, has a G value of 0.5.
The JQI scientists calculated and graphed G over time, showing how G has dropped over the years. In other words, inequality in energy consumption among the nations has been falling. Many economists attribute this development as a result of increased globalization in trade. And as if to underscore the underlying thermodynamic nature of the flow of commodities, a recent study by Branko Milanovic of the World Bank features a Gini curve very similar to that of the JQI curve. However, he was charting the decline of global income inequality by tracking the a parameter called purchasing power parity (PPP) among nations (4).
CAN IT CONTINUE?
The JQI curve suggests that the trend toward lesser inequality in energy consumption will start stalling out, as the energy consumption distribution begins to approach full exponential behavior. Is this because of the inexorable applicability of the laws of thermodynamics to national energy consumption? Just as with gas molecules, where some molecules are "rich" (possess high energy) and others "poor," are some nations destined to be rich and others poor?
Maybe not. Professor Yakovenko believes that one obvious way to alter the circumstances of energy distribution expressed in the figures above is the further development of renewable sources of energy. "These graphs apply to a well-mixed, globalized world, where a finite pool of fossil fuels is redistributable on a global scale. If the world switches to locally-produced and locally-consumed renewable energy and stops reshuffling the deck of cards (fossil fuels), then the laws of probability would not apply, and inequality can be lowered further. After all, the Sun shines roughly equally on everybody."
Yakovenko adds that for an exponential distribution what he calls "the rule of thirds" will be in effect. This means the top 1/3 of the world population will consume 2/3 of the total produced energy while the bottom 2/3 of the population will consume only 1/3 of the total energy.
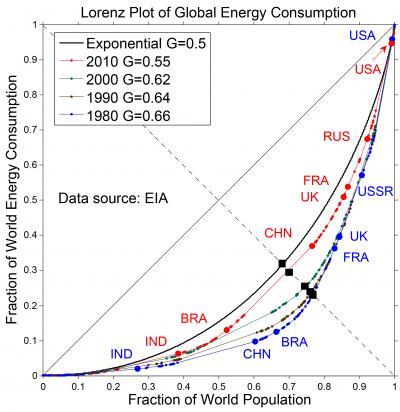
This is a plot of the accumulative capita energy consumption versus accumulative population for four different years: 1980 (blue curve), 1990 (brown), 2000 (green), 2010 (red) and idealized exponential (black).
(Photo Credit: Yakovenko)
Source: Joint Quantum Institute