"Humans can recognize thousands of categories. Given the limited size of the human brain, it seems unreasonable to expect that every category is represented in a distinct brain area," says first author Alex Huth, a graduate student working in Dr. Jack Gallant's laboratory at the University of California, Berkeley.
The authors proposed that perhaps a more efficient way for the brain to represent object and action categories would be to organize them into a continuous space that reflects the similarity between categories.
To test this hypothesis, they used blood oxygen level-dependent functional magnetic resonance imaging (BOLD fMRI) to measure human brain activity evoked by natural movies in five people. They then mapped out how 1,705 distinct object and action categories are represented across the surface of the cortex of the brain. Their results show that categories are organized as smooth gradients that cover much of the surface of the visual as well as nonvisual cortex, such that similar categories are located next to each other, and notably, this organization was shared across the individuals imaged.

Humans perceive numerous categories of objects and actions, but where are these categories represented spatially in the brain? Researchers reporting in the Dec. 20 issue of the Cell Press journal Neuron present their study that undertook the remarkable task of determining how the brain maps over a thousand object and action categories when subjects watched natural movie clips. The results demonstrate that the brain efficiently represents the diversity of categories in a compact space. Instead of having a distinct brain area devoted to each category, as previous work had identified, for some but not all types of stimuli, the researchers uncovered that brain activity is organized by the relationship between categories.
(Photo Credit: Huth et al., Neuron)
"Discovering the feature space that the brain uses to represent information helps us to recover functional maps across the cortical surface. The brain probably uses similar mechanisms to map other kinds of information across the cortical surface, so our approach should be widely applicable to other areas of cognitive neuroscience," says Dr. Gallant.
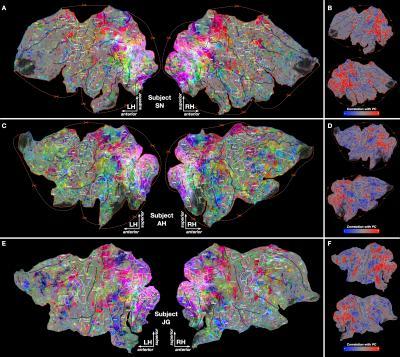
Similar to Figure 6 in the main text, this figure shows the semantic space projected onto the cortical surface for subjects SN, AH, and JG. (A,C,E) Category model weights for each cortical voxel are projected onto PCs 2-4 of the group semantic space, and then assigned a color according to the scheme described in Figure 4B. These colors are projected onto cortical flat maps constructed separately for each subject. Each location on these maps represents a single voxel. Locations with similar colors have similar semantic selectivity. Brain areas identified using functional localizers are outlined in white and labeled (see Table S1 for details). Uncertain anatomical boundaries are shown as dashed white lines. Major sulci are denoted by dark blue lines and labeled (see Table S2). Some anatomical regions are labeled in light blue (Abbreviations: PrCu = precuneus; TPJ = temporoparietal junction). Cuts made to the cortical surface during flattening are indicated by dashed red lines and a red border. Blue borders show the edge of the corpus callosum and subcortical structures. Regions of fMRI signal dropout are shaded with black hatched lines. (B,D,F) Projection of voxel model weights onto the first PC. Voxels that are positively correlated with the first PC appear red, while negatively correlated voxels appear blue. Voxels orthogonal to the first PC appear gray.
(Photo Credit: Huth et al., Neuron, Figure S5)
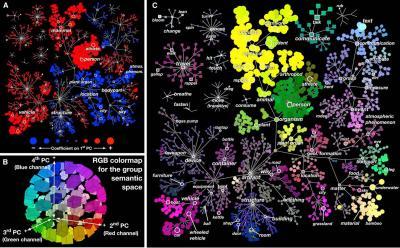
(A) Coefficients of all 1,705 categories in the first group PC, organized according to the graphical structure of WordNet. Links indicate "is a" relationships (e.g., an athlete is a person); some relationships used in the model have been omitted for clarity. Each marker represents a single noun (circle) or verb (square). Red markers indicate positive coefficients and blue indicates negative coefficients. The area of each marker indicates the magnitude of the coefficient. This PC distinguishes between categories with high stimulus energy (e.g., moving objects like "person" and "vehicle") and those with low stimulus energy (e.g., stationary objects like "sky" and "city").(B) The three-dimensional RGB colormap used to visualize PCs 24. The category coefficient in the second PC determined the value of the red channel, the third PC determined the green channel, and the fourth PC determined the blue channel. Under this scheme, categories that are represented similarly in the brain are assigned similar colors. Categories with zero coefficients appear neutral gray.(C) Coefficients of all 1,705 categories in group PCs 24, organized according to the WordNet graph. The color of each marker is determined by the RGB colormap in (B). Marker sizes reflect the magnitude of the three-dimensional coefficient vector for each category. This graph shows that categories thought to be semantically related (e.g., "athletes" and "walking") are represented similarly in the brain.
(Photo Credit: Huth et al., Neuron, Figure 4)
Source: Cell Press