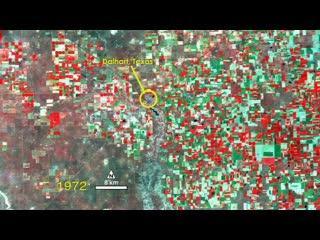
A water-rich polka dot pattern takes over the traditional rectangular patchwork of fields in this time series animation of 40 years of Landsat images. In the dry Texas panhandle near the town of Dalhart, this transformation is due to center-pivot irrigation, a farming method that improves water distribution to fields. It was invented by farmer Frank Zybach in 1949.
Center-pivot irrigation works by pumping water from the center of the field through a long pipe that rotates above growing crops like the hand of a clock. Evenly spaced sprinklers along the pipe deliver water with minimal loss to evaporation. Farmers like center-pivot irrigation because it works with a variety of soil types and it can be used on slopes where other gravity-driven forms of irrigation cannot.
As it caught on in the United States and abroad, it revolutionized agriculture since the system can be adapted to a wide variety of terrains and is more efficient with water and labor than other forms of irrigation. Together, all types of irrigation water 20 percent of cultivated fields worldwide, and those fields produce about 40 percent of the global food supply.
In this time series animation, vegetation appears red and the bare soil of fallow fields or sparsely vegetated grasslands appear white to green. The blue-gray X near the center of the images marks the town of Dalhart.
This series uses data from four Landsat satellites. Shown in this false color composite is light reflected from the near-infrared, red, and green regions of the electromagnetic spectrum (bands 4, 2, and 1 from the Multispectral Scanner Systems (MSS) aboard Landsat 1, 2, and 4, and bands 4, 3, and 2 from the Thematic Mapper (TM) aboard Landsat 5).
(Photo Credit: NASA/USGS)
The Landsat satellites have provided scientific data on Earth's land surfaces for the past 40 years: Landsat 1 from 1972 to 1978; Landsat 2 from 1975 to 1982; Landsat 3 from 1978 to 1983; Landsat 4 from 1982 to 1993; and Landsat 5 for a record-breaking 28 years from 1984 to what was likely its last data downlink in 2011.
Currently, Landsat 7, launched in 1999 is still providing data. The data from Landsat satellites has been instrumental in increasing our understanding of forest health, storm damage, agricultural trends, urban growth, and many other ongoing changes to our land.
NASA and the U.S. Department of the Interior through the U.S. Geological Survey (USGS) jointly manage Landsat, and the USGS preserves a 40-year archive of Landsat images that is freely available data over the Internet.
The next Landsat satellite, now known as the Landsat Data Continuity Mission (LDCM) and later to be called Landsat 8, is scheduled for launch in January 2013.
Source: NASA/Goddard Space Flight Center