Ice sheet researchers use computer models to simulate how ice sheets will respond to changes in ocean and air temperatures. An advantage of these simulations is that they allow testing of many different climate scenarios, but the models are limited by how accurate the data on ice volume and sub-ice terrain are. "In order to accurately simulate the dynamic response of ice sheets to changing environmental conditions, such as temperature and snow accumulation, we need to know the shape and structure of the bedrock below the ice sheets in great detail," said Michael Studinger, IceBridge project scientist at NASA Goddard.
Knowing what the bedrock looks like is important for ice sheet modeling because features in the bed control the ice's shape and affect how it moves. Ice will flow faster on a downhill slope, while an uphill slope or bumpy terrain can slow an ice sheet down or even hold it in place temporarily. "The shape of the bed is the most important unknown, and affect how ice can flow," said Nowicki. "You can influence how honey spreads on your plate, by simply varying how you hold your plate." The vastly improved bedrock data included in Bedmap2 should provide the level of detail needed for models to be realistic.
Disparate Data
Creating such a detailed map required researchers to collect and analyze large sums of data from a variety of sources. NASA contributed significant amounts of data on surface elevation, ice shelf limits and ice thickness. For example, measurements from three Operation IceBridge airborne campaigns make up about 12 percent of the 25 million ice thickness data points gathered by more than 200 airborne campaigns over the past 50 years.
IceBridge uses an ice-penetrating radar instrument known as the Multichannel Coherent Radar Depth Sounder to gather data on ice thickness and subglacial topography. MCoRDS, operated by the Center for the Remote Sensing of Ice Sheets at the University of Kansas, sends radar signals down through the ice and records the angle and timing of returning waves to image the ice surface, internal layering and the bedrock below.
Researchers also used a large amount of ICESat data to build the surface elevation grid in hard-to-measure areas. Satellite radar altimetry, which makes up a large portion of Bedmap2, works best in flat areas. Mountainous and steeply sloping areas call for other methods, and data from ICESat's laser altimeter helped researchers build an accurate map in these regions. In addition, the Bedmap2 team used IceBridge altimetry data to verify the accuracy of the combined surface datasets.
IceBridge data also played a big role by providing data on parts of Antarctica where there have been few to no measurements before. One such area is the Recovery Ice Stream, which IceBridge essentially put on the map with data from its 2011 Antarctic campaign. Both NASA and the U.S. National Science Foundation have invested a great deal of time and money in radars like MCoRDS and airborne campaigns like IceBridge over the years.
NASA's contributions go beyond merely collecting this data. By making its data freely available to researchers, NASA is leading a positive trend with researchers. "We hope that other partners will also go down this road," said Fretwell. Collecting radar sounding data over Antarctica is an expensive effort, which has led some researchers to be understandably protective. This could change, however, as more researchers make use of freely available data.
"More and more people in the research community realize the tremendous value of making data freely available," said Studinger.
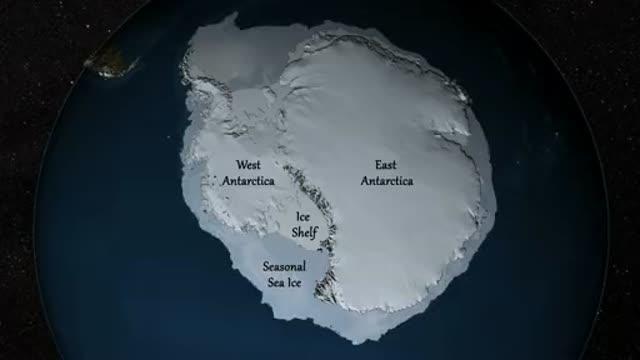
Our understanding of what lies beneath the world's biggest ice sheet has taken another leap forward. This video strips away Antarctic ice to reveal a new, and much more detailed map of the bedrock below. This map, called Bedmap2, was compiled by the British Antarctic Survey and incorporates millions of new measurements, including substantial data sets from NASA's ICESat satellite and an airborne mission called Operation IceBridge.
(Photo Credit: NASA Goddard's Scientific Visualization Studio)
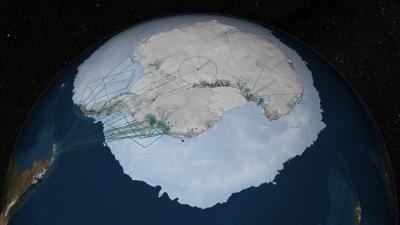
A significant portion of the data in Bedmap2 was collected by NASA's Operation IceBridge. Flight paths from the 2009, 2010 and 2011 Antarctic campaigns are shown here as dark green lines. NASA DC-8 flights originated from Punta Arenas, Chile, on the left side of the image. Flight lines in East Antarctica represent surveys flown by the Institute for Geophysics at the University of Texas at Austin, one of IceBridge's partnering organizations.
(Photo Credit: NASA Goddard's Scientific Visualization Studio)
Source: NASA/Goddard Space Flight Center