New research using combined records of ice measurements from NASA's Ice, Cloud and Land Elevation Satellite (ICESat), the European Space Agency's CryoSat-2 satellite, airborne surveys and ocean-based sensors shows Arctic sea ice volume declined 36 percent in the autumn and 9 percent in the winter over the last decade. The work builds on previous studies using submarine and NASA satellite data and confirms computer model estimates that showed ice volume decreases over the last decade, and builds a foundation for a multi-decadal record of sea ice volume changes.
In a report published online recently in the journal Geophysical Research Letters, a large international collaboration of scientists outlined their work to calculate Arctic sea ice volume. The satellite measurements were verified using data from NASA's Operation IceBridge, ocean-based sensors and a European airborne science expedition. This was compared with the earlier sea ice volume record from NASA's ICESat, which reached the end of its lifespan in 2009.
The researchers found that from 2003 to 2008, autumn volumes of ice averaged 11,900 cubic kilometers. But from 2010 to 2012, the average volume had dropped to 7,600 cubic kilometers – a decline of 4,300 cubic kilometers. The average ice volume in the winter from 2003 to 2008 was 16,300 cubic kilometers, dropping to 14,800 cubic kilometers between 2010 and 2012 – a difference of 1,500 cubic kilometers.
The study, funded by the United Kingdom's National Environmental Research Council ESA, the German Aerospace Center, Alberta Ingenuity, NASA, the Office of Naval Research and the National Science Foundation and led by Professor Seymour Laxon of University College London, marks the first ice volume estimates from CryoSat 2, which was launched in 2010. "It's an important achievement and milestone for CryoSat-2," said co-author Ron Kwok at NASA's Jet Propulsion Laboratory in Pasadena, Calif.
Combining the Ingredients
Although CryoSat-2 data show a decrease in ice volume from 2010 to 2012, two years is not a long enough time span to determine a trend. This is where NASA's data and scientists come in. Data from ICESat and IceBridge are freely available, but combining measurements from different sources can be challenging. Kwok said researchers spent months working out how to compare the datasets and make sure they were compatible enough to compare trends "We participated as collaborators to help interpret results from the datasets we're familiar with," said scientist Sinead Farrell at NASA's Goddard Space Flight Center in Greenbelt, Md.
CryoSat-2 and ICESat both measure sea ice freeboard, that is, the amount of ice floating above the ocean's surface. Researchers use freeboard to calculate ice thickness. This thickness measurement is then combined with ice area to come up with a figure for volume. The two satellites used different methods for measuring freeboard however. ICESat used a laser altimeter, which bounces a laser off the snow covering the sea ice, while CryoSat-2 uses a radar instrument that measures surface elevation closer to the ice surface. These instruments have a different view of the surface, but researchers found they gave comparable measurements.
Check and Double Check
Comparing the two datasets and ensuring their quality called for additional data. The two satellites do not cover overlapping time spans, so researchers used measurements from upward-looking sonar (ULS) moorings under the ocean's surface, located north of Alaska. These instruments, operated by the Woods Hole Oceanographic Institution's Beaufort Gyre Exploration Project, provide a continuous record of ice draft – thickness of ice below the ocean's surface – in parts of the Beaufort Sea from 2003 to the present day. Thickness measurements from these ULS moorings were comparable to ICESat and CryoSat-2 data throughout both missions' time spans. "ULS ice draft since 2003 served as the common data set for cross comparison of the ICESat and CryoSat-2 measurements," said Kwok.
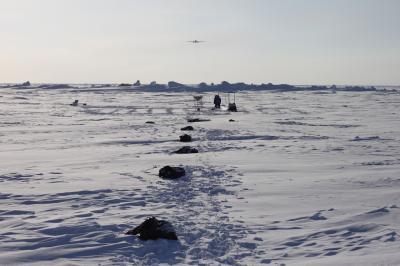
The Polar-5 aircraft, carrying the EM instrument that was used to validate Cryosat-2 sea ice thickness measurements, flying over the validation site.
(Photo Credit: : NERC/UCL/Rosemary Willatt)
Researchers took extra care to verify CryoSat-2's data as it is a new satellite with a new instrument. In addition to the ULS data, CryoSat-2 measurements were also verified by two airborne science campaigns: flights by an aircraft operated by the Alfred Wegener Institute for Polar and Marine Research in Bremerhaven, Germany; and Operation IceBridge, a NASA mission tasked with monitoring changes in polar ice to bridge the gap in measurements between ICESat and its replacement, ICESat-2, scheduled to launch in 2016. During the 2011 and 2012 Arctic campaigns, the IceBridge team coordinated closely with ESA's CryoVEx program to verify CryoSat-2 data. "IceBridge was used as a validation tool to understand thickness measurements from CryoSat-2," said scientist Nathan Kurtz at NASA Goddard.
The Road Ahead
After months of work, researchers had assembled a multi-year dataset that they could compare to sea ice volume predictions from the Pan-Arctic Ice-Ocean Modeling and Assimilation System (PIOMAS). Because of the short time span of previous satellite studies, researchers have used models like PIOMAS to simulate changes in sea ice volume. The study's observations show a larger autumn ice volume decrease than predicted, while changes in the winter are smaller than in the model simulation. "It's important to know because changes in volume indicate changes in heat exchange between the ice, ocean and atmosphere," said Kurtz.
This study and the knowledge that the datasets are compatible also serve to lay groundwork for ICESat-2. CryoSat-2 gathers data over more of the Arctic than ICESat did by reaching 88 degrees north (ICESat reached 86 degrees). ICESat-2 will orbit Earth at the same angle as CryoSat-2 and will therefore survey the same amount of the Arctic.
CryoSat-2 is funded through 2017 but will likely operate until the end of the decade, giving overlapping coverage with ICESat-2. This potential overlap greatly improves the prospects for improved knowledge of Arctic sea ice volume. "The hope is that we'll be able to create a multi-decadal record using ICESat, CryoSat-2 and ICESat-2," said Kwok.
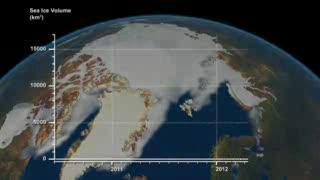
Animation showing changes in monthly Arctic sea ice volume using data from ESA's CryoSat-2 (red dots) and estimates from the Pan-Arctic Ice Ocean Modeling and Assimilation System (PIOMAS) (solid line) for the 2011 and 2012 winter growth periods (October April).
(Photo Credit: CPOM/UCL/ESA/UW-APL/NSIDC/Planetary Visions)

Sun glint off a sea ice lead in an otherwise heavily ridged ice pack, Canada Basin (Arctic Ocean).
(Photo Credit: : NASA/Sinead Farrell)
Source: NASA/Goddard Space Flight Center