NASA's TRMM satellite flew above intensifying tropical storm Haruna on February 20, 2013 at 0717 UTC (2:17 a.m. EST). A rainfall analysis was created using data from TRMM's Microwave Imager (TMI) and Precipitation Radar (PR) instruments overlaid on a combination visible/infrared image from the Visible and InfraRed Scanner (VIRS). The analysis showed that Haruna had become much better organized since Feb. 19 and developed intense bands of rainfall circling the cyclone's center. Some rain in powerful storms on the northern edge of Haruna's center was found by TRMM PR to be falling at a rate of over 108 mm (~4.25 inches) per hour.
NASA's TRMM Precipitation Radar (PR) was used to create a 3-D image that sliced through tropical storm Haruna's center. TRMM data showed that towering thunderstorms on the northern edge of Haruna's center were over 14.25 km (~8.85 miles) high.
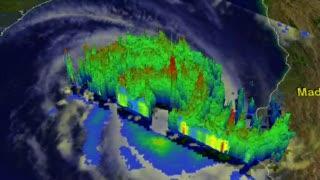
The TRMM satellite flew above Haruna on Feb. 20 at 0717 UTC. Some powerful storms Haruna's northern edge showed rainfall over 108 mm (~4.25 inches) per hour and cloud tops as high as 14.25 km (~8.85 miles). View video below to see a simulated flight above tropical storm Haruna.
(Photo Credit: Hal Pierce/SSAI/NASA)
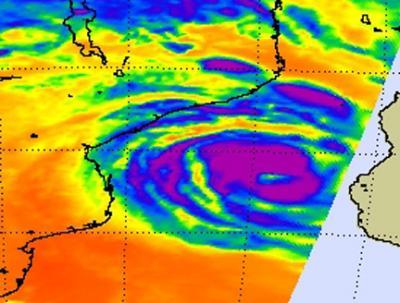
NASA-NOAA's Suomi NPP satellite captured infrared night-time data of Cyclone Haruna on Feb. 19 at 2303 UTC (2 a.m. local time Madagascar on Feb. 20). The data was false-colored at the University of Wisconsin Madison and showed the coldest cloud top temperatures and heaviest rainfall north of the center of circulation, verifying NASA's TRMM satellite data.
At 1500 UTC (10 a.m. EST) on Feb. 20, Haruna reached hurricane (or cyclone)-force with maximum sustained winds near 70 knots (80 mph/129.6 kph). Haruna is centered near 22.1 south latitude and 40.7 east longitude, about 400 nautical miles (460 miles/741 km) west-southwest of Antananarivo, Madagascar. Haruna is moving to the west at 4 knots (4.6 mph/7.4 kph) and generating 25-foot-high (7.6 meter-high) waves.
Forecasters at the Joint Typhoon Warning Center expect Haruna to make a brief landfall near Androka in the southwestern part of Madagascar as the storm heads southeast into the open waters of the southern Indian Ocean.
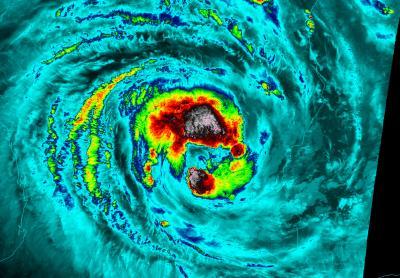
On Feb. 20 at 1111 UTC (6:11 a.m. EST/US) the AIRS instrument aboard NASA's Aqua satellite captured this infrared image of Tropical Cyclone Haruna. The area of strongest thunderstorms appear in purple, where cloud top temperatures were colder than -63F (-52C), and circle the large eye (yellow).
(Photo Credit: NASA JPL, Ed Olsen)
This false-colored infrared night-time image from NASA-NOAA's Suomi NPP satellite on Feb. 19 at 2303 UTC shows Cyclone Haruna's coldest cloud top temperatures (white) were north of the center.
(Photo Credit: NASA/NOAA/University of Wisconsin Madison)
Source: NASA/Goddard Space Flight Center