"Cities have had little information with which to guide reductions in greenhouse gas emissions – and you can't reduce what you can't measure," said Kevin Gurney, an associate professor in ASU's School of Life Sciences, and senior scientist with the Global Institute of Sustainability. "With Hestia, we can provide cities with a complete, three-dimensional picture of where, when and how carbon dioxide emissions are occurring."
The research team collected data from a wide variety of sources such as local air pollution reports, traffic counts, and tax assessor parcel information. The data is then combined within a modeling system for quantifying CO2 emissions at the level of individual buildings and street segments.
So far, scientists have applied Hestia to the city of Indianapolis, Indiana, and work is ongoing for the cities of Los Angeles, California and Phoenix, Arizona. They hope to ultimately map the CO2 emissions in all major cities across the United States, which accounts for nearly one-quarter of all global CO2 emissions. The Hestia research team believes this type of detailed emissions information can help determine what we as a society, can do locally and globally about climate change.
"As a community, we must take a leadership role in sustaining our relationship with the environment," said ASU President Michael M. Crow. "This research, and its implications for global engagement regarding climate change, is an exciting step forward. Hestia gives us the next tool we need to help policy-makers create effective greenhouse gas legislation."
Arizona State University researchers have developed a new software system capable of estimating greenhouse gas emissions across entire urban landscapes, all the way down to roads and individual buildings. Until now, scientists quantified carbon dioxide (CO2) emissions at a much broader level. Dubbed "Hestia" after the Greek goddess of the hearth and home, the system combines extensive public database "data-mining" with traffic simulation and building-by-building energy-consumption modeling. Its high-resolution maps clearly identify CO2 emission sources in a way that policy-makers can utilize and the public can understand. Hestia provides a complete, three-dimensional picture of where, when, and how carbon dioxide emissions are occurring.
(Photo Credit: Kevin Gurney, Bedrich Benes, Michel Abdul-Massih, Suzanna Remec, Jim Hurst)
"These results may also help overcome current barriers to the United States joining an international climate change treaty," agreed Gurney, Hestia's lead scientist. "Many countries are unwilling to sign a treaty when greenhouse gas emission reductions cannot be independently verified."
According to researchers, Hestia's increased detail and accuracy will help cities, and possibly even other nations, identify where an investment in energy and greenhouse gas savings would have the greatest impact.
"Leading in sustainability is not easy; however, as Mayor, I am committed to doing so," Phoenix Mayor Greg Stanton said. "Undoubtedly, Hestia will be a good tool to help us make more informed decisions as leaders in Phoenix and the Valley around issues of air quality, health and a sustainable future."
Although climate change presents society with tough challenges, Gurney believes this new system enables concrete, positive steps towards mitigating the problem.
"Hestia offers practical information we can use to identify the most cost-effective ways to reduce emissions and track progress over time," Gurney said. "Scientists have spent decades describing the seriousness of climate change. Now, we are offering practical information to help do something about it."
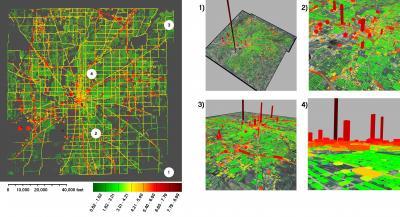
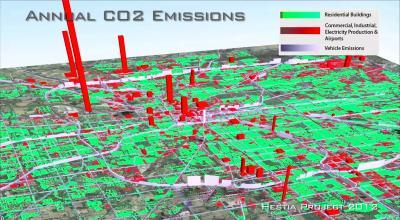
With Hestia, researchers from Arizona State University have a detailed understanding of where CO2 is being emitted from the urban landscape. This map shows where CO2 is emitted across the city of Indianapolis, Indiana, and combines data from sources including factories, automobiles on roadways, homes, and power plants.
(Photo Credit: Bedrich Benes and Michel Abdul-Massih)
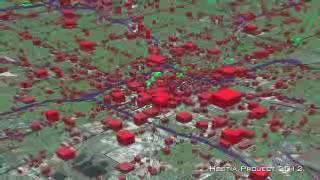
Researchers at Arizona State University and Purdue University created a visualization of the Hestia system that shows the hourly, building-by-building dynamics of CO2 emissions in the city of Indianapolis, Indiana.
(Photo Credit: Bedrich Benes and Michel Abdul-Massih)
Source: Arizona State University