NASA satellite data showed Tropical Storm Halong's "best side" or most powerful side was east of its center. That's where the coldest cloud top temperatures and strongest thunderstorms appeared on satellite imagery.
On August 1 at 13:30 UTC (9:30 a.m. EDT) the Moderate Resolution Imaging Spectroradiometer or MODIS instrument aboard NASA's Terra satellite captured an infrared picture of Tropical Storm Halong. The infrared data showed the coldest, strongest thunderstorm cloud-top temperatures east of the center of circulation. Cloud tops were as cold as -80F/-62C. Cloud top temperatures that cold indicate thunderstorm cloud tops are near the top of the troposphere, and have the potential to drop very heavy rainfall.
At 1500 UTC (11 a.m. EDT) Tropical Storm Halong had maximum sustained winds near 60 knots (69.0 mph/111.1 kph). It was centered near 14.9 north latitude and 137.9 east longitude, about 324 nautical miles (600 miles/372.9 km) north of Yap. It was moving to the west-northwest at 7 knots (8.0 mph/12.9 kph).
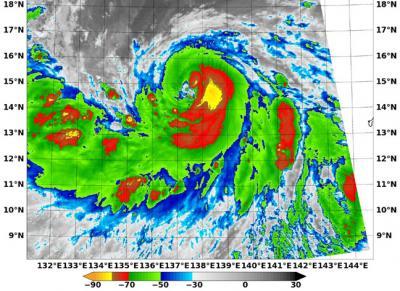
On Aug. 1 at 9:30 a.m. ED, NASA's Terra satellite captured this infrared picture of Tropical Storm Halong. Strongest storms and coldest cloud tops as cold as -80F/-62C (yellow) east of the center.
(Photo Credit: Image : NASA/NRL)
Forecasters at the Joint Typhoon Warning Center expect Halong to continue intensifying for the next three days before it begins a weakening trend. Halong is expected to pass near Okinawa sometime on August 6. For forecast updates from the Joint Typhoon Warning Center, visit: http://www.usno.navy.mil/JTWC/.
Source: NASA/Goddard Space Flight Center